High School Feeds Over 500 Kids
School Lunch Debt
Report Highlights. The national public school meal debt is $262 million a year.
- 1.54 million students can't afford their school meals.
- The average meal debt per child is $170.13 yearly.
- 75.1% of surveyed schools had unpaid student meal debt.
- 43% of surveyed school districts reported an annual increase in the number of students who couldn't afford meals.
Children in Debt
Children unable to afford a proper meal are defined as being food-insecure; they lack reliable access to food. Many of those children who owe school meal debt are part of families who earn too much to be considered for free or reduced lunch, but also earn too little to afford regular school meals.
- 1.54 million students pay full price for school meals they can't afford.
- Based on the national total, the average meal debt per child is $170.13 yearly.
- The Feeding America organization calculates that one in five food-insecure children lives in a home ineligible for free or reduced lunch.
- California had the most children with school meal debt – 327,686 children.
- North Dakota had the least number of children with school meal debt – 3,380 children.
- Delaware had the largest average debt per child at $188.49.
- Vermont had the smallest average debt per child at $139.66.
| State | Number of Children Food Insecure and Ineligible for Federal Assistance | Average Debt per Child |
|---|---|---|
| Alabama | 48,776 | $171.89 |
| Alaska | 6,938 | $151.05 |
| Arizona | 69,710 | $169.13 |
| Arkansas | 33,488 | $172.12 |
| California | 327,686 | $167.90 |
| Colorado | 35,472 | $169.88 |
| Connecticut | 23,048 | $170.51 |
| Delaware | 6,950 | $188.49 |
| District of Columbia | 5,290 | $148.58 |
| Florida | 170,976 | $168.56 |
| Georgia | 100,674 | $169.16 |
| Hawaii | 10,708 | $171.27 |
| Idaho | 13,984 | $168.62 |
| Illinois | 90,652 | $170.52 |
| Indiana | 54,676 | $172.51 |
| Iowa | 22,304 | $164.45 |
| Kansas | 26,042 | $171.03 |
| Kentucky | 37,332 | $168.43 |
| Louisiana | 51,128 | $169.10 |
| Maine | 9,404 | $167.16 |
| Maryland | 40,932 | $172.82 |
| Massachusetts | 31,990 | $171.99 |
| Michigan | 69,026 | $170.81 |
| Minnesota | 32,662 | $168.45 |
| Mississippi | 32,706 | $168.23 |
| Missouri | 48,622 | $172.43 |
| Montana | 7,382 | $177.46 |
| Nebraska | 16,474 | $174.94 |
| Nevada | 27,360 | $172.37 |
| New Hampshire | 6,328 | $165.61 |
| New Jersey | 52,068 | $166.05 |
| New Mexico | 23,606 | $166.48 |
| New York | 146,460 | $169.94 |
| North Carolina | 92,326 | $170.27 |
| North Dakota | 3,380 | $155.03 |
| Ohio | 102,006 | $169.52 |
| Oklahoma | 42,744 | $171.63 |
| Oregon | 33,058 | $166.43 |
| Pennsylvania | 87,468 | $170.74 |
| Rhode Island | 7,152 | $183.17 |
| South Carolina | 40,422 | $168.52 |
| South Dakota | 7,382 | $177.46 |
| Tennessee | 57,154 | $169.61 |
| Texas | 331,736 | $173.75 |
| Utah | 27,188 | $173.46 |
| Vermont | 3,752 | $139.66 |
| Virginia | 49,494 | $169.39 |
| Washington | 56,952 | $170.21 |
| West Virginia | 15,394 | $170.20 |
| Wisconsin | 39,458 | $172.64 |
| Wyoming | 4,792 | $164.02 |
Money Lost to Unpaid Meal Debt
Schools cannot pay off meal debts using federal child nutrition funds – they must be written off as an operating loss. Schools may look to state, local, or charitable sources to try to offset the meal debt. The following information was obtained from the School Nutrition Association's 2019 Trends Report and Survey.
- $10.9 million was the total meal debt from surveyed districts.
- 31% of school districts with unpaid meal debts also incurred a deficit for that school year.
- However, even after recovering all unpaid meal debt, 30% of those school districts would still have been in deficit for other unrelated expenses.
- 75.1% of schools had unpaid student meal debt.
- 43% of school districts reported an annual increase in the number of students who couldn't afford meals.
- A total of 89.4% of school districts lost revenue equal to less than 1% of their annual expenses to unpaid meal debt.
- A total of 10% of school districts lost revenue equal to more than 1% of their annual expenses but less than 10% of those annual expenses to unpaid meal debt.
- A total of 0.7% of school districts lost revenue equal to more than 10% of their annual expenses.
- On average, the net revenue school districts lost to unpaid meals was less than 1% of the total expenses for the year.
- The median amount of debt in a typical school district has risen from $2,250 to $3,400.
- Since 2012, the median amount of unpaid meal debt per school district rose by 70%.
| Amount of Debt Paid | Percentage of Districts Paid |
|---|---|
| None | 27.6% |
| Less than 25% | 15.1% |
| 25% to 50% | 15.5% |
| 51% to 99% | 17.8% |
| 100% | 24.1% |
| Average Amount | 46.2% |
Funding Sources
Since schools cannot pay off meal debts using federal child nutrition funds, many surveyed schools looked to other sources such as charity or PTA funds. The "other" category included funding sources such as graduating seniors, roll-over balances, student household funds, or special food sales.
- This data set comes from a survey of 392 school districts across the nation.
- The parents category describes situations in which the parents/students originally had debt but managed to pay off all or some of the debt by themselves.
- Overall, charitable funds and general district funds were the largest contributors to paying off meal debt regardless of the school district size or the region of the U.S.
| Source | Percentage of School Districts that Received Money |
|---|---|
| Charity | 55.4% |
| School District General Funds | 36.2% |
| Parents | 21.9% |
| Individual School Funds | 11.7% |
| PTA/PTO Funds | 11.2% |
| A la Carte/ Adult Meal Sales/Catering | 6.6% |
| State or Local Funds | 1.0% |
| Other | 2.3% |
| Not Sure | 3.8% |
Meal Debt State by State
The meal debt per state was estimated by taking the average debt per child for each state and multiplying that with the number of food insecure children ineligible for federal assistance. Debt varies wildly between states due to population sizes.
- Texas has the largest meal debt at $57.6 million.
- North Dakota and Vermont are tied with least amount of meal debt at $524,000.
- Washington D.C., though not a state itself, has a meal debt of $786,000
| State | Total State Debt |
|---|---|
| Alabama | $8.38 Million |
| Alaska | $1.05 Million |
| Arizona | $11.8 Million |
| Arkansas | $5.76 Million |
| California | $55 Million |
| Colorado | $6.03 Million |
| Connecticut | $3.93 Million |
| Delaware | $1.31 Million |
| District of Columbia | $786,000 |
| Florida | $28.9 Million |
| Georgia | $17 Million |
| Hawaii | $1.83 Million |
| Idaho | $2.36 Million |
| Illinois | $15.5 Million |
| Indiana | $9.43 Million |
| Iowa | $3.67 Million |
| Kansas | $4.45 Million |
| Kentucky | $6.29 Million |
| Louisiana | $8.65 Million |
| Maine | $1.57 Million |
| Maryland | $7.07 Million |
| Massachusetts | $5.50 Million |
| Michigan | $11.8 Million |
| Minnesota | $5.50 Million |
| Mississippi | $5.50 Million |
| Missouri | $8.38 Million |
| Montana | $1.31 Million |
| Nebraska | $2.88 Million |
| Nevada | $4.72 Million |
| New Hampshire | $1.05 Million |
| New Jersey | $8.65 Million |
| New Mexico | $3.93 Million |
| New York | $24.9 Million |
| North Carolina | $15.7 Million |
| North Dakota | $524,000 |
| Ohio | $17.3 Million |
| Oklahoma | $7.34 Million |
| Oregon | $5.50 Million |
| Pennsylvania | $14.9 Million |
| Rhode Island | $1.31 Million |
| South Carolina | $6.81 Million |
| South Dakota | $1.31 Million |
| Tennessee | $9.70 Million |
| Texas | $57.6 Million |
| Utah | $4,716,000 |
| Vermont | $524,000 |
| Virginia | $8.38 Million |
| Washington | $9.70 Million |
| West Virginia | $2.62 Million |
| Wisconsin | $6.81 Million |
| Wyoming | $786,000 |
National School Lunch Program
The National School Lunch Program (NSLP) serves children lunches from pre-k all the way to grade 12. They have the option to provide afterschool and summer meals as well.
- The NSLP serves meals to 29.7 million children daily.
- The NSLP provides 20.2 million free lunches daily.
- The NSLP provides 1.8 million reduced-price lunches daily ($0.40 each).
- The NSLP provides 7.7 million full-price lunches daily.
- The NSLP serves 10.8 billion lunches annually.
- An estimated 100,000 schools participate in the NSLP.
- Congress spends $13.8 billion annually on the NSLP program.
- California had the largest number of students eligible for free/reduced lunch prices at 3,335,885 students.
- North Dakota had the fewest number of students eligible for free/reduced lunch prices at 29,929 students.
- Mississippi had the largest percentage of students eligible for free/reduced lunch prices at 70.6%.
- Washington D.C. had 73% of students eligible but is not a state itself.
- New Hampshire had the fewest percentage of students eligible for free/reduced lunch prices at 25.2%.
| State | Number of Students Eligible for Free or Reduced-Price Lunch | Percentage of Students Eligible for Free or Reduced-Price Lunch |
|---|---|---|
| Alabama | 402,386 | 55.1% |
| Alaska | 50,701 | 38.4% |
| Arizona | 482,044 | 45.2% |
| Arkansas | 291,608 | 60.5% |
| California | 3.34 Million | 54.1% |
| Colorado | 336,426 | 39.9% |
| Connecticut | 190,554 | 34.5% |
| Delaware | 61,564 | 48% |
| District of Columbia | 52,027 | 73% |
| Florida | 1.48 Million | 56% |
| Georgia | 961,954 | 57.4% |
| Hawaii | 84,106 | 46.8% |
| Idaho | 124,104 | 45% |
| Illinois | 921,471 | 46.7% |
| Indiana | 485,728 | 46.8% |
| Iowa | 188,486 | 38.9% |
| Kansas | 228,852 | 47.7% |
| Kentucky | 380,773 | 56.6% |
| Louisiana | 460,546 | 66.2% |
| Maine | 78,915 | 43% |
| Maryland | 341,557 | 40.1% |
| Massachusetts | 326,849 | 34.2% |
| Michigan | 719,800 | 46.4% |
| Minnesota | 306,136 | 36.5% |
| Mississippi | 345,734 | 70.6% |
| Missouri | 406,358 | 45% |
| Montana | 57,836 | 41.2% |
| Nebraska | 127,114 | 42.6% |
| Nevada | 219,904 | 50.3% |
| New Hampshire | 48,904 | 25.2% |
| New Jersey | 444,735 | 32.8% |
| New Mexico | 227,077 | 67.6% |
| New York | 1.32 Million | 48.3% |
| North Carolina | 747,978 | 50.3% |
| North Dakota | 29,929 | 31.7% |
| Ohio | 745,121 | 42.6% |
| Oklahoma | 398,917 | 60.5% |
| Oregon | 280,174 | 50.6% |
| Pennsylvania | 686,641 | 39.4% |
| Rhode Island | 61,127 | 42.9% |
| South Carolina | 395,033 | 54.7% |
| South Dakota | 46,718 | 37.1% |
| Tennessee | 542,953 | 55% |
| Texas | 2.47 Million | 50.3% |
| Utah | 223,943 | 38.2% |
| Vermont | 31,339 | 36.8% |
| Virginia | 458,879 | 36.7% |
| Washington | 418,065 | 40.1% |
| West Virginia | 145,605 | 51.5% |
| Wisconsin | 342,660 | 39.3% |
| Wyoming | 32,968 | 37.1% |
School Breakfast Program
The School Breakfast Program (SBP) serves children breakfast from pre-k all the way to grade 12. They have the option to provide summer meals as well.
- The SBP serves meals to 14.7 million children daily.
- The SBP provides 11.8 million free breakfasts daily.
- The SBP provides 735,000 reduced-price breakfasts daily ($0.30 each).
- The SBP provides 2.2 million full-price breakfasts daily.
- The SBP serves 45 billion breakfasts annually.
- An estimated 90,600 schools participate in the SBP.
- Congress spends $4.4 billion annually on the SBP program.
Actions Taken to Recover Debt (2011 to 2012)
This data comes from the Special Nutrition Program Operations Study. A federal study required under the Healthy, Hunger-Free Kids Act of 2010.
- Only 14% of school districts recovered all of the unpaid debt.
- 51% of school districts recovered no money at all.
- On average, school districts recover 31% of the meal debt.
| Action Taken | Percentage |
|---|---|
| Bill the Parents | 94.1% |
| Provide an Alternative Meal until the Debt is Repaid | 60.1% |
| Administrative Actions (Withhold Grades, Prevent from Graduating) | 35.5% |
| Try to have the Student Retroactively Approved for Free Meals | 25.0% |
| Hire a Debt Collection Agency | 5.9% |
| Other Actions | 9.2% |
| No Action Taken to Recover Debt | 0.4% |
Cost of School Meals
School breakfast is significantly cheaper than school lunch but serves fewer children overall. Federal regulations set the minimum nutrition standards that go into a school meal. General nutrition standards require more whole grains, fruits, and vegetables and less sugar, fat, and sodium.
- The average cost of school lunch is between $2.48 and $2.74.
- School breakfast is between $1.46 and $1.55.
- In an average 31 day month, school lunch costs anywhere between $76.88 and $89.94.
- School breakfast for 31 days would cost between $45.26 and $48.05.
- A full school year of school lunch costs between $446.40 and $493.20.
- A year of school breakfast costs anywhere between $262.80 and $279.00.
Cost to Make a School Meal (2014)
The cost to make a school is broken down primarily between food costs and labor costs. Foodservice directors must balance the budget while meeting federal standards; arranging the meal plans, contracting the food supplier, scheduling meal periods, etc.
- Food accounts for 44.7% of the cost of a school meal.
- Labor accounts for 44.5%. of the cost of a school meal.
- 10.8% goes into supplies, contracted help, equipment and various other support services
- The average cost to produce a school lunch was $3.81.
- The federal free lunch subsidy was $3.32.
- The average cost to produce a school breakfast was $2.72.
- The federal free breakfast subsidy was $1.88.
| School Type | Average Price | Number of Schools Surveyed |
|---|---|---|
| Grade | ||
| Elementary | $3.72 | 57,215 |
| Middle | $3.90 | 17,114 |
| High | $4.13 | 20,328 |
| School Size | ||
| Small (Less than 500 students) | $3.96 | 46,544 |
| Medium (500 to 999 students) | $3.65 | 37,152 |
| Large (1,000 or more students) | $3.99 | 10,961 |
| School Location | ||
| Urban | $3.79 | 20,669 |
| Suburban | $3.91 | 41,150 |
| Rural | $3.78 | 32,838 |
School Breakfast Differences
The school breakfast program does not sell as many meals as the school lunch program. The required nutrition values in a school breakfast are also different from a school lunch. Participation in school breakfast was found to lower the risk of childhood obesity.
- Vegetables are optional for school breakfasts.
- Breakfasts must offer a daily meat or meat alternative.
- The average cost to produce a school breakfast was $2.72.
- The federal free breakfast subsidy was $1.88.
| School Type | Average Price | Number of Schools Surveyed |
|---|---|---|
| Grade | ||
| Elementary | $2.58 | 54,566 |
| Middle | $2.85 | 16,055 |
| High | $2.71 | 18,898 |
| School Size | ||
| Small (Less than 500 students) | $2.80 | 43,400 |
| Medium (500 to 999 students) | $2.51 | 35,563 |
| Large (1,000 or more students) | $2.57 | 10,556 |
| School Location | ||
| Urban | $2.54 | 20,039 |
| Suburban | $2.67 | 38,763 |
| Rural | $2.71 | 30,717 |
Meal Program Money Lost to Covid-19
In general, rural areas anticipated less financial loss to Covid-19 restrictions than larger more urban communities. To adapt to Covid, School meal programs implemented alternative programs where the meal is eating away from school. These programs utilized Drive-Throughs, Pick-ups, and Delivery of meals.
School location
- 1755 schools were surveyed.
- 68% of schools anticipated financial losses to their school meal program budgets
- 90% of schools cited losing money as a serious or moderate concern
- 71.4% of the schools in large cities anticipated a financial loss in their meal program.
- 80.3% of schools in suburbs near large cities anticipated a financial loss in their meal program.
- 66.4% of the schools in small cities or towns anticipated a financial loss in their meal program.
- 58% of schools in rural areas, anticipated a financial loss in their meal programs.
School size
- 41.5% of schools with a student population of fewer than 1,000 students anticipated financial loss.
- 62.5% of the schools with a student population between 1,000 and 2,499 students anticipated financial loss.
- 70.7% of schools with a student population between 2,500 and 4,999 students anticipated financial loss.
- 74.8% of the schools with a student population between 5,000 and 9,999 students anticipated financial loss.
- 77.8% of schools with a student population between 10,000 and 24,999 students anticipated financial loss.
- 73.7% of the schools with a student population between 25,000 or more students anticipated financial loss.
- The total overall loss to school meal programs was $626,438,567 dollars.
- The median loss per district was $200,000.
- Amongst the largest school districts with more than 25,000 students enrolled, the median loss was $2.35 million.
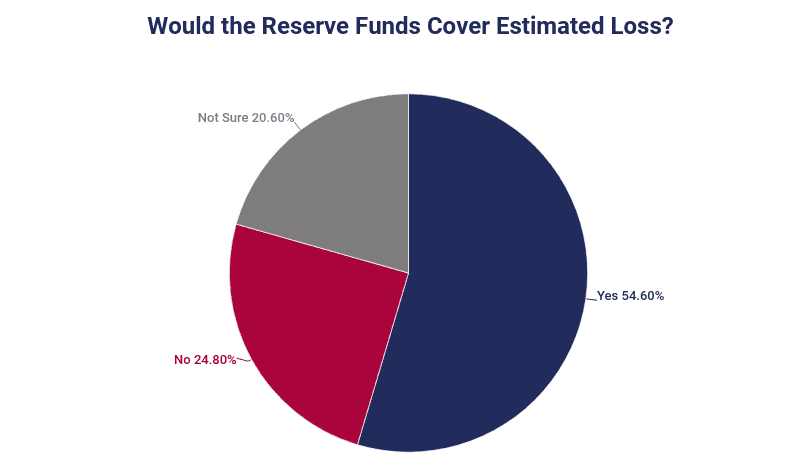
Reserve Funds
For this survey, schools were asked the question, "Would your reserve funds cover your estimated loss?" Rural schools with a lower student population had fewer reserve funds than the bigger city-type schools with large populations.
School location
- 1177 schools were surveyed.
- 61.2% of those schools stated they had reserve funds.
- 70.2% of the large city-type schools stated they had reserve funds.
- 70.8% of suburb schools near a large city, stated they had reserve funds.
- 60.2% of the small city or town-sized schools, stated they had reserve funds.
- 49.2% of rural schools stated they had reserve funds.
School size
- 26% of the schools with a student population of fewer than 1,000 students stated they had reserve funds.
- 44.6% of schools with a student population between 1,000 and 2,499 students stated they had reserve funds.
- 64.1% of the schools with a student population between 2,500 and 4,999 students stated they had reserve funds.
- 70% of schools with a student population between 5,000 and 9,999 students stated they had reserve funds.
- 72.5% of the schools with a student population between 10,000 and 24,999 students stated they had reserve funds.
- 80.5% of schools with a student population of 25,000 or more students stated they had reserve funds.
Lunch Shaming Defined
According to the National Education Association, "Lunch Shaming" is the practice of embarrassing students whose meal accounts have a negative balance. These are actions taken to coerce the student and their family into paying overdue meal bills. Many states have adopted various anti-lunch shaming policies, but the practice still shows up in new iterations not previously considered.
- Forcing the student to take alternative meals.
- Throwing away meals.
- Restriction to school events.
- Withholding grades.
- Preventing graduation.
- Being singled out with easily identifiable notices/tickets/tokens.
- Being forced to work for a school meal.
- Taking parents to delinquency court.
Meal Debt Policy by State
The U.S. Department of Agriculture has largely left decision-making on meal debt policy in the hands of state and local school authorities. Some states continue the trend, they delegate their authority as well- leaving policy decisions solely in the hands of local school districts.
Alabama
- Alabama's Department of Education provides general guidelines but leaves specific decision-making to the district authorities
Alaska
- Alaska has no formal statewide policy – decisions are made at the district level.
Arizona
- Arizona has developed at the state level-specific restrictions that affect meal charging policy.
Arkansas
- Arkansas prohibits providing an alternative meal.
- This state also prohibits throwing away a meal.
- Working for meals is optional in Arkansas.
- School districts have the option to charge extra fees or assign debt collectors to an unpaid meal debt.
- School districts have the option to deny the student's participation in school activities.
- Arkansas schools also have the option to communicate directly with parents rather than the child.
California
- California prohibits providing an alternative meal.
- California prohibits throwing away a meal.
- This state prohibits work for meals programs.
- School districts have the option to assign debt collectors and tack on extra fees to a school meal debt.
- California schools are prohibited from denying the student's participation in school activities.
- California schools have the option to communicate directly with parents instead of the child.
Colorado
- Colorado has no statewide policy – policy is decided at the district level.
Connecticut
- Connecticut has no statewide policy – policy is decided at the district level.
Delaware
- Delaware has no state policy; decisions are made at the local, district level.
Florida
- Florida has no state policy; decisions are made at the local, district level.
Georgia
- Georgia's policies are decided at the district level.
Hawaii
- Schools in Hawaii have the option to provide alternative meals to children.
- The schools are prohibited from throwing away a meal.
- Working for meals is optional in Hawaii schools.
- State law gives schools the option to tack on extra fees or utilize debt collection agencies.
- The schools have the option to deny a student's participation in school activities for unpaid meal debt.
- Schools in Hawaii have the option to communicate directly with the parents about a meal debt.
Idaho
- Idaho's policies are decided at the district level.
Illinois
- Illinois schools have the option to provide an alternative meal to children.
- State law prohibits schools from throwing away a meal.
- Under state law, schools have the option to implement work for meals programs.
- Schools have the option to add extra fees to unpaid meal debt and to send it to a debt collection agency.
- The schools can deny a student's participation in school activities.
- The schools have the option to communicate directly with parents.
Indiana
- Indiana has no statewide policy – policy is decided at the district level.
Iowa
- Iowa schools, they have the option to provide alternative meals.
- The schools are prohibited from throwing away a meal.
- State law prohibits work for meals programs.
- State law leaves it optional for schools to utilize debt collection agencies and to include extra fees to unpaid meal debts.
- Denying a student's participation in school activities is prohibited under state law.
- It is required for schools to communicate directly with parents rather than through the child.
Kansas
- Kansas has no statewide policy – policy is decided at the district level.
Kentucky
- Kentucky has state policy banning discrimination and physical separation of children from their peers for being unable to pay for meals.
Louisiana
- Providing an alternative meal is optional in Louisiana.
- Throwing away a meal is optional under state law.
- Working for meals programs is optional under state law.
- Schools have the option to induce extra fees and use debt collection services.
- Denying a student's participation in school activities is optional under Louisiana law.
- Louisiana schools are required to communicate directly with parents about meal debts.
Maine
- Maine schools have the option to provide alternative meals to children.
- Throwing away a meal is prohibited under Maine law.
- Programs, where students work for meals, are optional under state law.
- Including extra fees and utilizing debt collection services is optional for Maine schools.
- Denying a student's participation in school activities is an option for Maine schools.
- Maine schools are required to communicate directly with parents concerning their child's meal debts.
Maryland
- Maryland lacks a state policy; decisions are made at the district level.
Massachusetts
- Massachusetts has guidelines developed at the state level that govern account balances, collections, and fund deposit.
Michigan
- Michigan lacks a state policy; decisions are made at the district level.
Minnesota
- Minnesota state law allows schools to provide alternative meals.
- State law gives schools the option to throw away meals.
- Schools have the option to implement work for meals programs.
- Schools may implement additional fee charges and utilize debt collection services.
- Minnesota schools may deny a student's participation in school activities.
- It is optional if schools wish to communicate directly with the parents.
Mississippi
- Mississippi's policies are decided at the district level.
Missouri
- Missouri's policies are decided at the district level.
Montana
- Montana has no formal statewide policy – districts have decision-making authority.
Nebraska
- Nebraska's policies are decided at the district level.
Nevada
- Nevada lacks a state policy; decisions are made at the district level.
New Hampshire
- New Hampshire's state policy leaves it optional for a school to provide alternative meals.
- Throwing away a meal is optional under state law.
- Schools have the option to implement work for meals programs.
- Extra fees and debt collection practices are permissible under state law.
- New Hampshire schools can deny a student's participation in school activities.
- Schools are required to communicate directly with the parents.
New Jersey
- New Jersey state policy leaves it optional for schools to provide alternative meals.
- Throwing away a meal is optional under state law.
- Works for meals programs are optional in New Jersey schools.
- The use of debt collection agencies and additional fees are optional alternatives for New Jersey schools.
- Schools have the option to deny a student's participation in school activities.
- New Jersey schools are required to communicate directly with the parents regarding the meal debt.
New Mexico
- State schools are allowed to provide alternative meals to children.
- Schools are prohibited from throwing away meals.
- New Mexico prohibits schools from utilizing work for meals programs.
- Schools are prohibited from tacking on extra fees or using debt collection services.
- Schools have the option to deny a student's participation in school activities.
- Under state law, the schools are required to communicate directly with the parents.
New York
- In New York, schools are prohibited from providing alternative meals to children.
- Throwing away a meal is prohibited in state schools.
- Working for meals programs is an optional choice for New York schools.
- New York schools are prohibited from adding extra fees are utilizing debt collection agencies.
- Denying a student's participation in school activities is optional in New York schools.
- Communicating directly with the parents about a meal debt is required under state law.
North Carolina
- North Carolina has no formal statewide policy – districts have decision-making authority.
North Dakota
- North Dakota's policies are decided at the district level.
Ohio
- Ohio lacks a state policy; decisions are made at the district level.
Oklahoma
- Oklahoma has no statewide policy – policy is decided at the district level.
Oregon
- State law prohibits schools from providing alternative meals.
- Schools cannot throw away meals under state law.
- Oregon schools are prohibited from implementing work for meals programs.
- Adding extra fees and utilizing debt collection agencies are optional choices for schools in Oregon.
- Schools may deny a student's participation in school activities.
- Schools are required to make direct contact with parents over their child's unpaid meal debt.
Pennsylvania
- Providing alternative meals is optional under state law.
- Schools are prohibited from throwing away a meal.
- State law prohibits schools from implementing work for meals programs.
- Schools have the option to add extra fees and utilize debt collection services.
- Denying a student's participation in school activities is an optional choice for Pennsylvania schools.
- State law requires the school to contact the parents directly about meal debt.
South Carolina
- South Carolina has no statewide policy – policy is decided at the district level.
South Dakota
- South Dakota lacks a state policy; decisions are made at the district level.
Tennessee
- Tennessee lacks a state policy; decisions are made at the district level.
Texas
- Texas state law requires students be given a grace period to set up a payment plan when the student runs out of funds in their account.
Utah
- Utah has no statewide policy – policy is decided at the district level.
Vermont
- Vermont has no statewide policy – policy is decided at the district level.
Virginia
- Providing an alternative meal is an option for schools in Virginia.
- Throwing away a meal is an option for schools under state law.
- Work for meals programs are prohibited in Virginia schools.
- The addition of extra fees and use of debt collection services is optional for Virginia schools.
- Virginia schools can deny participation in school activities as a consequence for delinquent meal debts.
- The schools are required to communicate directly with the parents concerning a meal debt.
Washington
- Providing an alternative meal is prohibited in Washington schools.
- Throwing away a meal is prohibited under state law.
- Washington prohibits schools from implementing work for meals programs.
- Extra fees and the use of debt collection agencies are prohibited in Washington.
- Schools have the option to deny participation in school activities for students with an outstanding meal debt.
- It is required under state law for schools to communicate directly with the parents about meal debt.
West Virginia
- West Virginia's state policy prohibits counties from penalizing students with meal debt.
Wisconsin
- Providing alternative meals is an option for schools in Wisconsin.
- Throwing away a meal is prohibited in Wisconsin schools.
- Implementing work for meals programs is optional under state law.
- Tacking on extra fees and utilizing debt collection services is prohibited in Wisconsin.
- Schools can deny participation in school activities for students who have a meal debt.
- Schools are required to communicate directly with the parents regarding their child's meal debt.
Wyoming
- Wyoming has no formal statewide policy – decisions are made at the district level.
Sources
- Food and Nutrition Service U.S. Department of Agriculture
- School Nutrition Association
- National Education Association
- National Center For Education Statistics
- The Food Assistance Landscape: FY 2018 Annual Report USDA
- Feeding America: Child Food Insecurity 20
Source: https://educationdata.org/school-lunch-debt
0 Response to "High School Feeds Over 500 Kids"
Post a Comment